How to measure Pipeline Health & export data
Pipeline Health & Efficiency
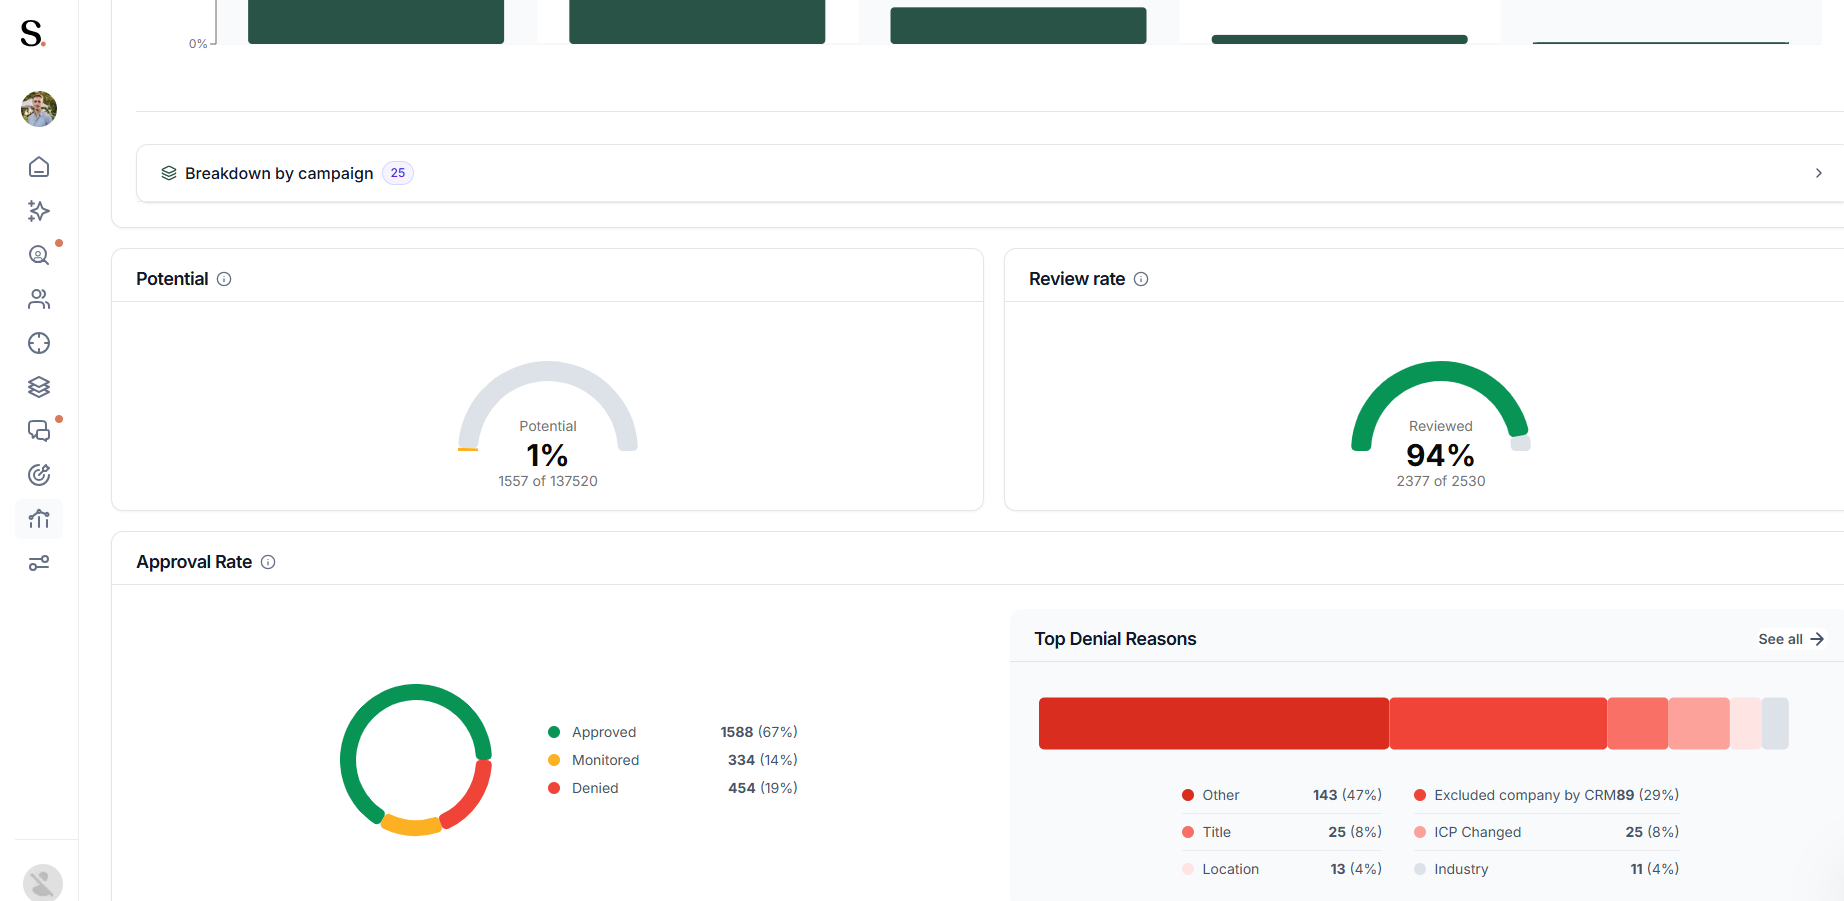
The bottom section tracks the quality and quantity of your lead pool, helping you evaluate volume and efficiency across your pipeline.
- Potential: Best practice is to send around 20–25 connection requests per day per profile. This metric reflects the number of requests sent compared to your total available potential within the selected period.
- Review Rate: This graph shows the efficiency of your review process, indicating how many suggested prospects have been reviewed during the selected time frame (e.g., 99% reviewed).
- Approval Rate: Breaks down the decisions made on prospects, showing the percentage Approved, Monitored, or Denied. If you want to learn more about what each prospect status means, refer to the complete guide.
- Top Denial Reasons: A bar chart that categorizes why prospects were rejected (e.g., wrong Title, Industry, or Competitor), providing insights to refine your targeting criteria.
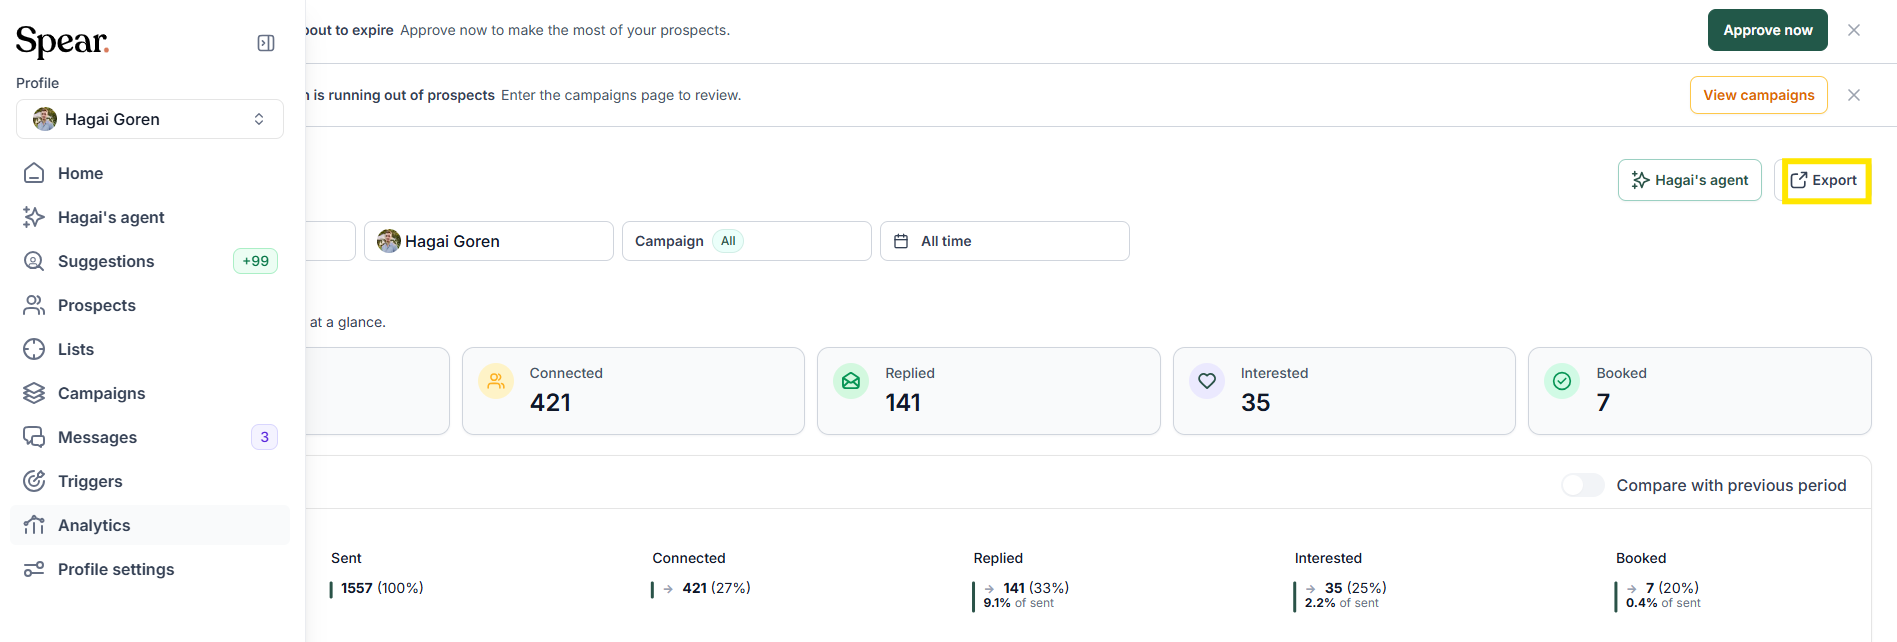
Export Data
The Export to CSV button, located in the top-right corner, downloads a CSV containing prospects with a ‘Sent’ status that match your currently applied filters. This is useful for CRM logging or offline performance analysis.
Related Articles
Ready to ensure your reports reflect reality? Now that you know how to interpret your performance metrics, read our guide on How to override funnel statuses to learn how to adjust prospect status when the data needs a correction manually.


.avif)