Home>Knowledge Base>Analytics>How to use the Funnel View & Campaign Breakdown

How to use the Funnel View & Campaign Breakdown

Calendar icon marking the date this article was publishedMay 12, 2026
Clock icon marking how long this article takes to read5 min read

Funnel View

A visual bar chart showing your prospect journey within your selected time frame.

  • Conversion percentages (Replied, Interested, Booked) include decimals (e.g., 0.47%) for high precision in targeted campaigns.
Funnel view chart showing the drop from all sent messages down through connections, replies, interested prospects and booked meetings

The Funnel View is interactive. Click on any purple bar (Sent, Connected, Replied, Interested, or Booked) to open a detailed Funnel Status panel on the right.
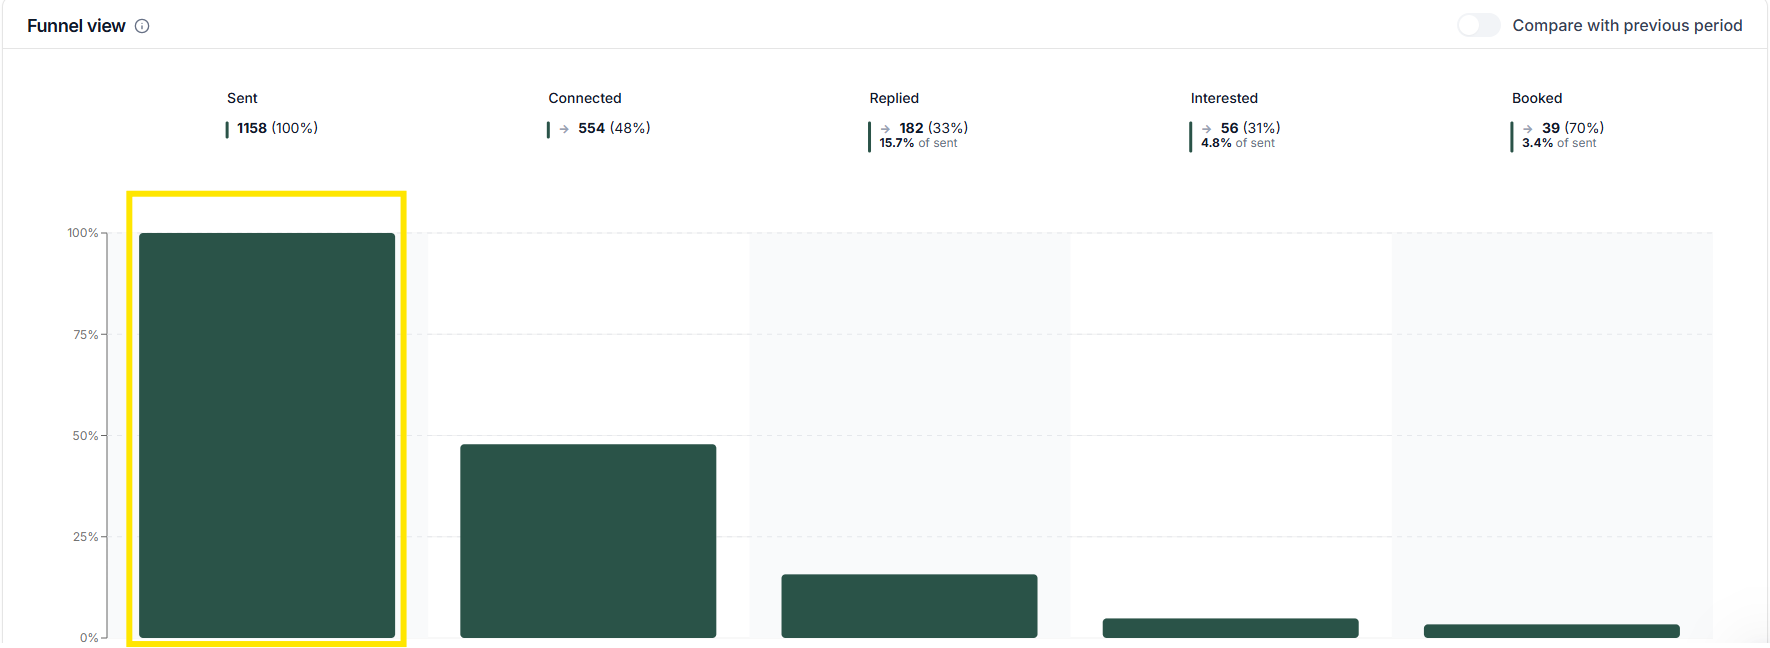
Funnel view chart with the first bar highlighted, showing sent, connected, replied, interested and booked as descending columns
Analytics dashboard with the funnel status side panel opened over it, showing the sent tab and the breakdown of prospect job titles

Once the panel is open, switch between funnel stages using the tabs at the top:

  • Sent
  • Connected
  • Replied
  • Interested
  • Booked

The selected tab is highlighted in yellow. Each tab updates the data to reflect only prospects currently in that specific stage.
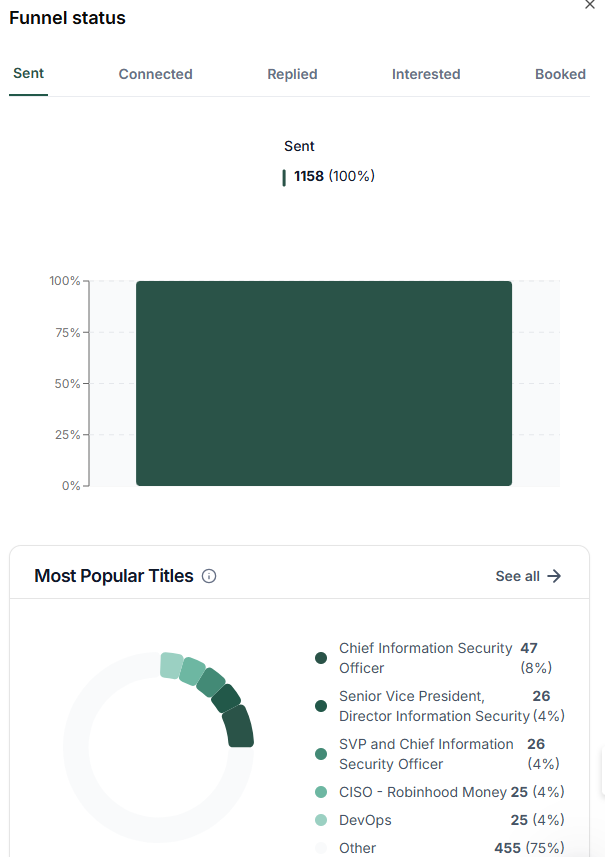
Funnel status panel opened on the sent tab, with a full width bar for every message sent and the popular titles breakdown underneath

What you can see in the panel:

  • Most Popular Titles — distribution of prospect job titles within that stage
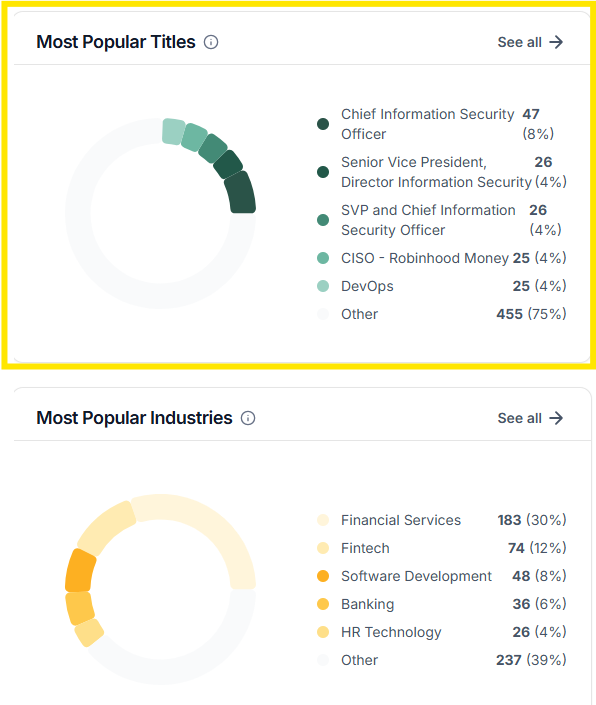
Most popular titles card highlighted, listing the security leadership roles that make up the audience together with their share of it
  • Most Popular Industries — industries represented in that stage
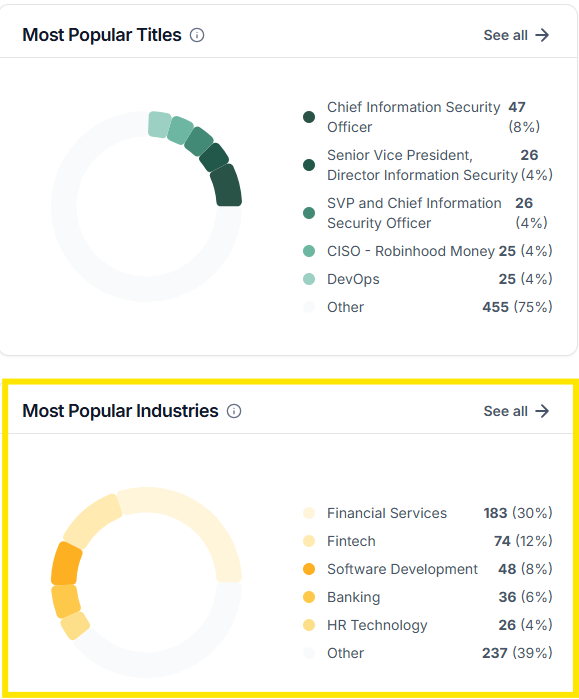
Most popular titles and most popular industries cards side by side, with the industries card highlighted and financial services leading the list
  • Most Popular Triggers — which triggers contributed to prospects reaching that stage
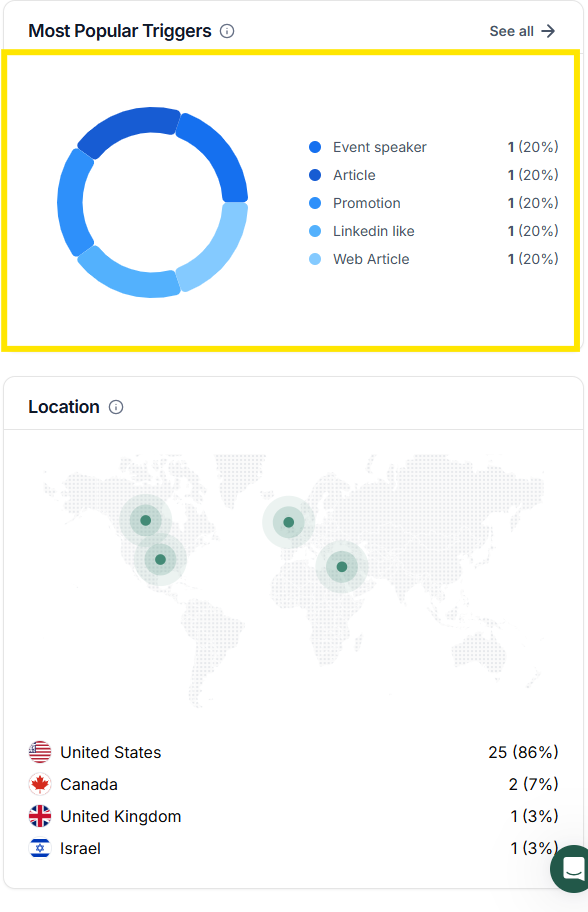
Most popular triggers card highlighted, splitting the triggers evenly between event speaker, article, promotion, LinkedIn like and web article, above a location map

Breakdown by Campaign

This table offers a granular view of performance per campaign. It lists each active campaign (e.g., Cyber custom, ICPPC) and displays its individual statistics for Sent, Connected, Replied, Interested, and Booked. This allows you to A/B test different strategies to see which messaging or targeting is performing best.
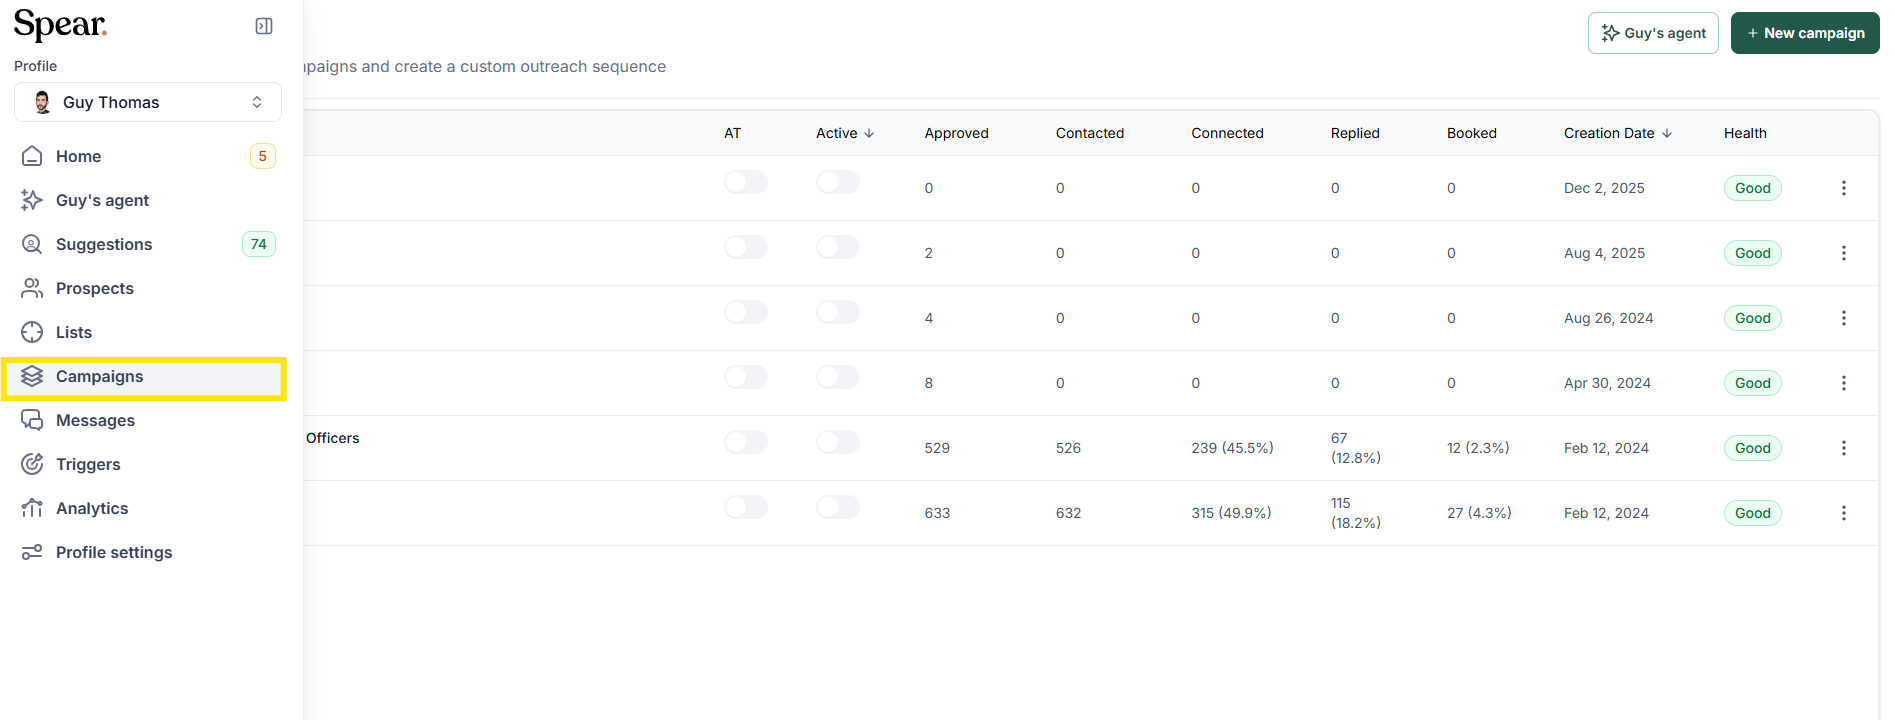
Campaigns page with Campaigns highlighted in the side navigation and a table listing every campaign with its approved, contacted, replied and booked counts

📌 Want to measure the health of your pipeline? See How to measure Pipeline Health & export data.

Sign up for Updates

Get the playbook on outbound that actually converts.

We care about data. Check out our privacy policy.

Thank you!
Your submission has been received!
Oops! Something went wrong while submitting the form.
Line illustration of a spear on a coral background, beside the newsletter signup

Turn Triggers Into Pipeline

With Spear, companies leverage trigger-based outbound to craft a quality-driven GTM motion that actually books meetings.

Illustration of a person holding a spear on a hilltop path at sunriseIllustration of a person holding a spear on a hilltop path at sunrise